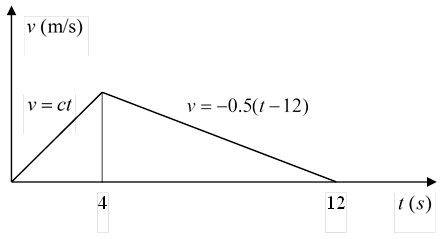
1-2. A car travels along a straight
road with the speed shown in the ![]() graph. Assume
graph. Assume ![]() is greater than zero
and follows a normal distribution
is greater than zero
and follows a normal distribution![]() , plot the
, plot the ![]() graph and calculate
the probability that the speed
graph and calculate
the probability that the speed ![]() reaches 5 m/s.
reaches 5 m/s.
Solution
![]() graph:
for
graph:
for ![]()
![]()

For ![]()
![]()
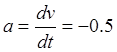
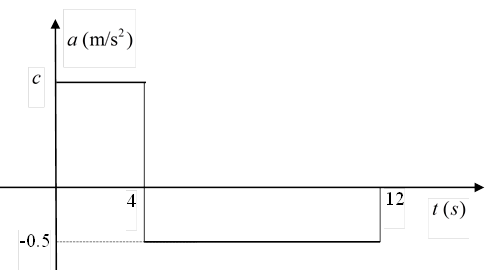
The graph of
the acceleration is shown below.
Since ![]() and
and ![]() , when
, when ![]() , the speed reaches its maximum, therefore,
, the speed reaches its maximum, therefore,
![]()
And
![]()
![]()
So
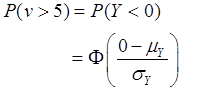
![]() Ans.
Ans.